บทความ
ดัชนี Crypto Fear & Greed index คืออะไร? อีกเครื่องมือที่นักเทรดต้องมีติดตัว

หากคุณเป็นนักเทรด ไม่ว่าจะโปรหรือใหม่ การมีเครื่องมืออย่าง Indicator และ Index ต่าง ๆ เพื่อช่วยสร้างกลยุทธ์เป็นสิ่งที่ขาดไม่ได้ และบทความนี้จะนำเครื่องมือที่ได้รับความนิยมในระดับโลกอย่าง Crypto Fear & Greed index มาให้ทุกคนได้เรียนรู้กัน
ทำความเข้าใจ Fear & Greed Index คืออะไร?

Fear & Greed Index หากแปลตรงตัวก็คือดัชนีความกลัวและความโลภ หมายความว่าเป็นดัชนีที่ใช้วัดภาพรวมเกี่ยวกับอารมณ์ของนักลงทุนในตลาดว่ากำลังมีอารมณ์ไปในทางกลัวหรือโลภมากกว่ากัน
เนื่องจากอารมณ์เป็นอีกปัจจัยสำคัญที่มีผลต่อการเคลื่อนไหวของราคาคริปโทเคอร์เรนซี เพราะนักลงทุนเมื่อเกิดความกลัวต่อสภาวะตลาดก็จะพากันเทขายสินทรัพย์ ทำให้ราคาสินทรัพย์ลดลง กลับกัน หากนักลงทุนเกิดความโลภ ก็จะพากันซื้อจนราคาสินทรัพย์พุ่งสูงขึ้น การวิเคราะห์โดยใช้ Fear & Greed Index จึงเป็นอีกหนึ่งวิธีที่ได้รับความนิยมจากนักลงทุนมืออาชีพจำนวนมาก
Fear & Greed Index ที่พัฒนาโดย CNNMoney เป็นเครื่องมือที่ได้รับความนิยมมากในตลาดหุ้น และสำหรับตลาดคริปโทเคอร์เรนซีเองก็มีดัชนี Crypto Fear & Greed Index ด้วยเช่นกัน โดยดัชนีจะมีการอัปเดตทุก ๆ 8 ชั่วโมง และสามารถใช้งานได้ผ่านทางเว็บไซต์ https://alternative.me/crypto/fear-and-greed-index/
ค่าวัด Fear & Greed Index นำมาวิเคราะห์การลงทุนใน Bitcoin ได้อย่างไร?

การเคลื่อนไหวของตลาดคริปโตมีความเกี่ยวข้องกับอารมณ์ค่อนข้างมาก ไม่ว่าจะมาจาก FOMO (Fear of missing out) หรือกลัวตกรถจนพากันรีบเข้าซื้อจนราคาพุ่งสูงขึ้น หรือ FUD (Fear, uncertainty, and doubt) ที่ทำให้นักลงทุนเกิดความกลัว ไม่มั่นใจ และพากันเทขายจนราคาร่วงลง
การที่นักลงทุนสามารถเข้าใจได้ว่าตอนนี้อารมณ์ของตลาดกำลังอยู่ในภาวะใด จะสามารถทำให้นักลงทุนสามารถสร้างกลยุทธ์การลงทุนที่มีประสิทธิภาพยิ่งขึ้นได้ และดัชนี Fear & Greed Index ก็ถูกสร้างมาเพื่อการนี้โดยเฉพาะ
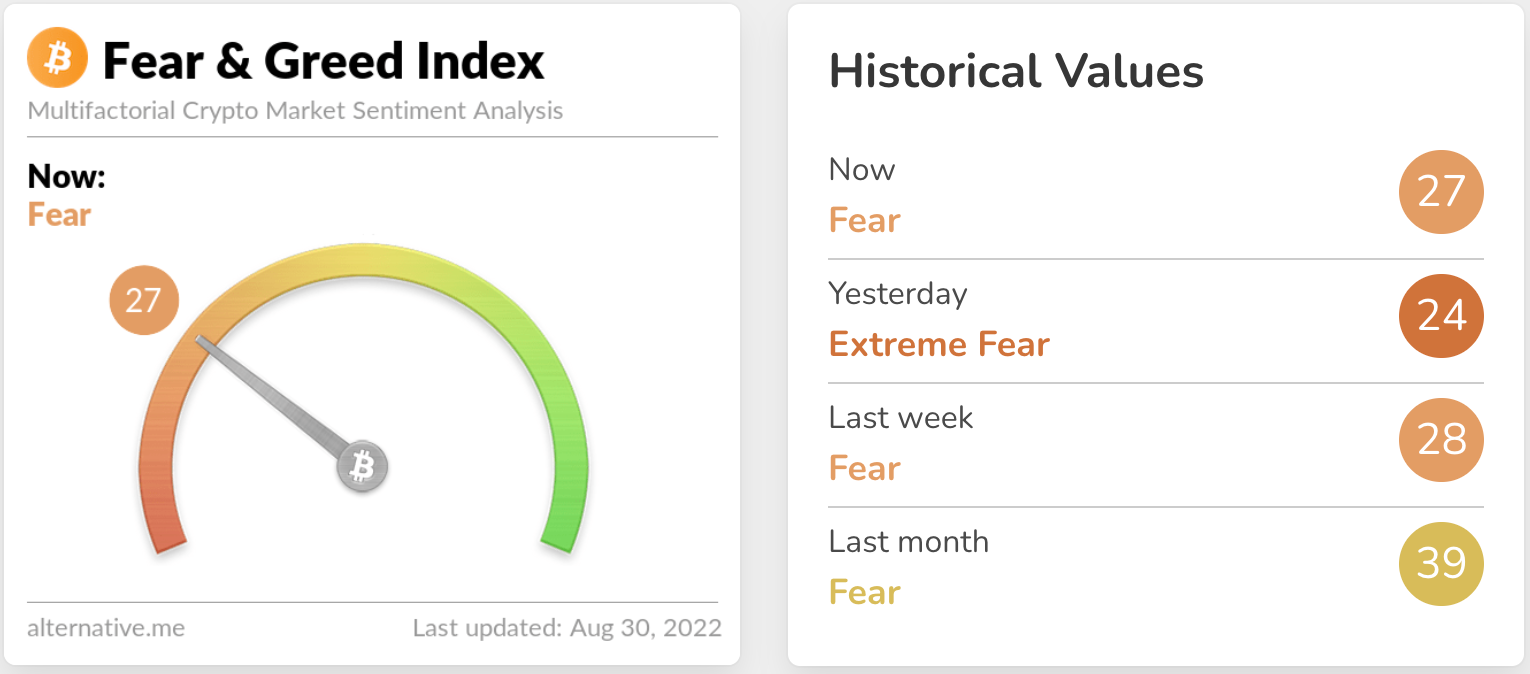
ค่าวัดในดัชนี Fear & Greed Index มีตั้งแต่ 1–100 โดยสามารถแบ่งออกเป็น 4 ช่วงได้ดังนี้
0–24 = กลัวแบบสุด ๆ (Extreme Fear)
24–49 = เริ่มกลัว (Fear)
50–74 = เริ่มโลภ (Greed)
75–100 = โลภแบบสุด ๆ (Extreme Greed)
เมื่อเข้าใจว่าอารมณ์ของตลาดอยู่ในช่วงไหน เราก็สามารถนำมาปรับใช้กับกลยุทธ์ตามหลักการต่อไปนี้
1. หากตลาดอยู่ในภาวะกลัว (Fear, Extreme Fear) อาจวิเคราะห์ได้ว่าราคาอาจปรับตัวลดลงก่อน และราคาจะเริ่มทรงตัวเพราะไม่มีการเข้ามาลงทุนเพิ่ม จึงอาจเป็นโอกาสที่ดีสำหรับการเข้าซื้อ
2. หากตลาดอยู่ในภาวะโลภ (Greed, Extreme Greed) อาจวิเคราะห์ได้ว่าราคาอาจปรับตัวสูงขึ้น แต่เมื่อปรับขึ้นได้ระดับนึงแล้วราคาอาจถูกเทขายทำกำไรหรือเกิดการ Correction จึงอาจเป็นโอกาสที่ดีสำหรับการขาย
ค่า Crypto Fear & Greed คำนวณมาจากอะไร?

ดัชนีทุกประเภทล้วนเป็นผลลัพธ์จากการนำข้อมูลตัวเลขจากหลาย ๆ แหล่งที่เกี่ยวข้องเข้ามาคำนวณร่วมกัน ซึ่ง Crypto Fear & Greed ก็เช่นกัน โดยปัจจัย (Data Sources) ที่ถูกนำมาคำนวณมีดังต่อไปนี้
Volatility (25%)
เป็นการคำนวณโดยดูจากความผันผวนกับ Maximum Drawdown ของราคา Bitcoin และนำไปเปรียบเทียบกับค่าเฉลี่ยย้อนหลัง 30 วัน และ 90 วัน โดยยิ่งมีความผันผวนมากเท่าไหร่ อาจสะท้อนว่าตลาดมีความกลัวมากเท่านั้น
Market Momentum/Volume (25%)
เป็นการคำนวณปริมาณซื้อขายร่วมกับแนวโน้มของตลาด (เปรียบเทียบกับค่าเฉลี่ยย้อนหลัง 30/90 วัน) โดยหากมีปริมาณซื้อขายสูงขึ้นอาจสะท้อนว่าตลาดกำลังมีความโลภเพิ่มขึ้น
Social Media (15%)
เป็นการตรวจสอบว่าคำว่า Bitcoin หรือคำที่เกี่ยวข้องถูกพูดถึงบ่อยแค่ไหนบนโซเชียลมีเดีย เช่น ดูจาก # (Hashtag) บน Twitter ว่าถูกกล่าวถึงบ่อยแค่ไหนในระยะเวลาหนึ่ง ยิ่งถูกพูดถึงบ่อยก็เท่ากับว่าคนกำลังให้ความสนใจ และตลาดกำลังมีความโลภมากขึ้นเท่านั้น
Surveys 15% (หยุดใช้ตัวนี้ชั่วคราว)
ทำแบบสำรวจความคิดเห็นบนเว็บไซต์ strawpoll.com โดยจะเปิดรับความคิดเห็นจากผู้ใช้วันละ 2,000–3,000 คน และนำมาคำนวณหาค่าเฉลี่ย
Dominance 10%
เป็นการคำนวณโดยดูว่า Bitcoin กำลังมีสัดส่วนเป็นเท่าไหร่เมื่อเทียบกับมูลค่าตลาดคริปโตทั้งหมด โดยมองว่าถ้า Bitcoin มีส่วนแบ่งในตลาดคริปโตเยอะ หมายความว่านักลงทุนกำลังกังวลว่าเหรียญเล็ก ๆ หรือ Altcoin มีความเสี่ยงมากเกินไป จึงต้องการหาที่หลบภัย กลับกัน หาก Bitcoin มีส่วนแบ่งตลาดน้อยลงหมายความว่านักลงทุนเข้าซื้อ Altcoin เพราะคาดหวังว่าจะได้กำไรมากกว่า เท่ากับว่าตลาดกำลังมีความโลภมากขึ้น
Trends 10%
เป็นการวิเคราะห์จาก Google Trends เพื่อดูว่ามีการค้นหาคำที่เกี่ยวข้องมากไหน โดยดูทั้งเรื่องของจำนวนการค้นหา และคำค้นหาที่เกี่ยวข้อง เช่น ถ้าดูว่ามีการค้นหาคำว่า Bitcoin เพิ่มมากขึ้นแค่ไหนอย่างเดียวอาจให้ข้อมูลได้ไม่มากนัก แต่ถ้าดูคำค้นหาที่เกี่ยวข้องร่วมด้วย เช่น ถ้าคำที่เกี่ยวกับข้องมีคำว่า “bitcoin price manipulation” (การปั่นราคา bitcoin) ถูกค้นหาเพิ่มมากขึ้น 1,550% ก็อาจสะท้อนได้ว่าตลาดกำลังมีความกลัวมากขึ้น เป็นต้น
สรุป
Fear & Greed Index เป็นดัชนีที่ใช้ดูภาพรวมอารมณ์ของตลาดว่ากำลังมีความกลัวหรือความโลภในการลงทุน โดยคำนวณจากหลายปัจจัย ได้แก่ ความผันผวน ปริมาณซื้อขาย การพูดถึงในโซเชียล มูลค่าตลาด และการค้นหาคำ โดยข้อมูลที่ได้จากดัชนีสามารถนำไปปรับกลยุทธ์การลงทุนให้มีประสิทธิภาพมากขึ้นได้ เช่น หากตลาดอยู่ในภาวะกลัว อาจเป็นโอกาสที่ดีสำหรับการเข้าซื้อ หรือหากตลาดอยู่ในภาวะโลภ ก็อาจเป็นโอกาสที่ดีสำหรับการขาย เป็นต้น
อ้างอิง: Crypto Fear & Greed Index, Trinity, Seeking Alpha
— — — — -
อ่านบทความเกี่ยวกับ “Bitcoin” ที่น่าสนใจ ได้ที่นี่
-ทำความเข้าใจ Bitcoin คืออะไร? ภายใน 3 นาที
-ทำความรู้จัก Altcoins เหรียญคริปโตทางเลือก
-มัดรวม 6 กลยุทธ์ลงทุนคริปโทฯ ที่นักเทรดนิยมใช้
— — — — -
ติดตามบทความ ข่าวสาร และความรู้ที่น่าสนใจเรื่อง บิทคอยน์ (Bitcoin), Cryptocurrecy และความรู้อีกมากมายในวงการคริปโต ได้ที่ Bitkub Blog
-คริปโทเคอร์เรนซีและโทเคนดิจิทัลมีความเสี่ยงสูง ท่านอาจสูญเสียเงินลงทุนได้ทั้งจํานวน โปรดศึกษาและลงทุนให้เหมาะสมกับระดับความเสี่ยงที่ยอมรับได้
-สินทรัพย์ดิจิทัลมีความเสี่ยง โปรดศึกษาและลงทุนให้เหมาะสมกับระดับความเสี่ยงที่ยอมรับได้
-ผลตอบแทนของสินทรัพย์ดิจิทัลในอดีตหรือผลการดําเนินงานในอดีต มิได้เป็นสิ่งยืนยันถึงผลตอบแทน ของสินทรัพย์ดิจิทัลหรือผลการดําเนินงานในอนาคต
— — — — -
What is Crypto Fear & Greed index? The tool that traders must know.
If you are a trader whether an expert or beginner. It is indispensable to have tools like indicators and indexes to help build strategies, and this article introduces you to a Crypto Fear & Greed index an investment tool that everyone can learn and use efficiently.
What is the Fear & Greed Index?
The Fear & Greed Index is used to measure the overall mood of investors in the investment market whether they are more afraid or greedy.
This is because emotion is another important factor that affects cryptocurrency price movements. When investors are afraid of market conditions, they will likely sell assets, causing the asset’s price to drop. On the other hand, if investors are greedy, they will buy until the price of the asset soars. Analysis using the Fear & Greed Index is another popular method that many professional investors use.
The Fear & Greed Index developed by CNNMoney is a very popular indicator in the stock market. For the cryptocurrency market, there is the Crypto Fear & Greed Index. The index is updated every 8 hours and is available through this website Fear & Greed index.
How to use Fear & Greed Index in Bitcoin investment?
Crypto market movements are quite emotionally connected. Whether it comes from FOMO (Fear of missing out) that makes people rush to buy until the price rises or FUD (Fear, uncertainty, and doubt) that make investors fearful and uncertain until they sell the asset making the price falls.
Supposing that investors can understand what the market mood is at that moment. It can enable investors to create more effective investment strategies, and the Fear & Greed Index was created specifically for this purpose.
Fear & Greed Index ranges from 1–100, which can be divided into four categories:
0–24 = Extreme Fear
24–49 = Fear
50–74 = Greed
75–100 = Extreme Greed
Understanding the market mood, we can apply the strategy according to the following principles.
1. If the market is in a state of fear (Fear, Extreme Fear), it can be analyzed that the price may decline first then the price will start to stabilize because there is no additional investment. Therefore, it can be a good opportunity to buy.
2. If the market is greedy (Greed, Extreme Greed), it can be analyzed that the price may rise, but when it rises to a certain level, some investors may sell to take profit and correction may occur which can be a good opportunity to sell before the correction.
How is Crypto Fear & Greed calculated?
All indices are the result of the computation of numerical data from several relevant sources, and Crypto Fear & Greed is no exception. The data sources that are calculated are as follows.
Volatility (25%)
It is calculated by looking at the Bitcoin price’s volatility and Maximum Drawdown and comparing it to 30-day and 90-day historical averages.
Market Momentum/Volume (25%)
It calculates the trading volume in conjunction with the market trend. (compared to the 30/90-day historical average). If there is a higher trading volume, it may reflect that the market is becoming more greedy.
Social Media (15%)
It checks how often the word Bitcoin or related terms are mentioned on social media, for example, by looking at the # (hashtag) on Twitter, and how often it is mentioned over a period of time. The more often it is mentioned, the more people are paying attention and the market may become more greedy.
Surveys 15% (currently paused)
Take a survey on the website strawpoll.com It will accept opinions from 2,000–3,000 users per day and calculate the average.
Dominance 10%
It is a calculation based on how much Bitcoin is currently dominating to the total crypto market cap. It means investors are worrying that cryptocurrencies or altcoins are too risky. Conversely, if Bitcoin has a smaller market share, it means that investors are buying Altcoins expecting to make more profit. It means that the market is becoming more greedy.
Trends 10%
This is an analysis from Google Trends to see how many related words are being searched by looking at both the subject of the number of searches and related search terms. For example, looking at how many searches for Bitcoin are increasing alone may not provide much information, but if you look at related search terms as well, for example, if the related term “bitcoin price manipulation” gets a 1,550% increase in searches, it could indicate that the market is fearful.
Conclusion
The Crypto Fear & Greed Index is an index used to look at the overall market sentiment whether there is fear or greed in investing. It is calculated from many factors, including volatility, and trading volume. Social Mentions, Market Value, and Keyword Searches. The information obtained from the index can be used to adjust investment strategies to be more effective, for example, if the market is in fear. It could be a good opportunity to buy or if the market is greedy It could be a good opportunity to sell.
_____________________________________________________
Disclaimers:
- Cryptocurrency and digital tokens involve high risks; investors may lose all investment money and should study information carefully and make investments according to their own risk profile.
- Digital assets involve risks; investors should study information carefully and make investments according to their own risk profile.
- Returns/Past Performance does not guarantee future returns/performance.
- Such information is not a proposal for investment or a plan for investing in digital assets. The content above uses analytical techniques and historical data to examine price trends. There could be differences. Before investing in digital assets, Investors should study and understand before investing in digital assets.
ที่มา:
Medium