บทความ
วิธีดูกราฟคริปโต ง่ายกว่าที่คิด!

บทความนี้จะเป็นการปูพื้นฐานความรู้เกี่ยวกับการดูกราฟคริปโตในขั้นพื้นฐาน เพื่อให้ผู้อ่านสามารถนำความรู้ที่ได้ไปต่อยอดให้การเทรด Crypto ของคุณมีประสิทธิภาพยิ่งขึ้น
ประเภทของกราฟ Crypto มีอะไรบ้าง?
เริ่มต้นกันที่ประเภทของกราฟคริปโต เนื่องจากเป็นสิ่งแรกที่ทุกคนเห็นเมื่อเข้าสู่หน้าเทรด โดยสามารถแบ่งประเภทกราฟที่นิยมใช้กันได้ดังนี้
1.กราฟแท่งเทียน (Candlesticks)
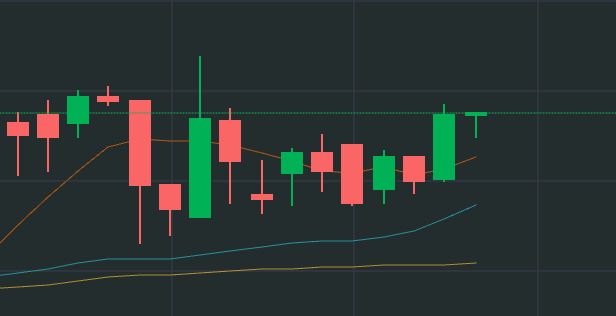
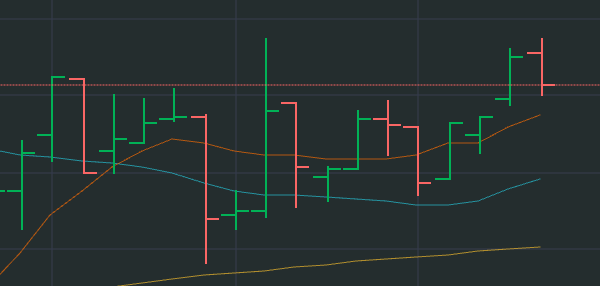
2.กราฟแท่ง (Bar Chart)
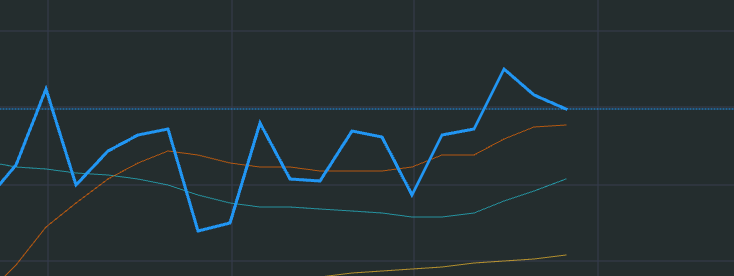
3.กราฟเส้น (Line Chart)
วิธีดูกราฟแท่งเทียน
บทความนี้จะเน้นไปที่กราฟแท่งเทียน เนื่องจากเป็นกราฟที่ได้รับความนิยมมากที่สุดทั้งนักเทรดมือใหม่และมือโปร
กราฟแท่งเทียนมีจุดเด่นที่มันสามารถบอกข้อมูลได้หลายอย่างจากการมองเพียงครั้งเดียว โดยที่ตัวแท่งเทียนจะมีส่วนประกอบตามภาพด้านล่างนี้
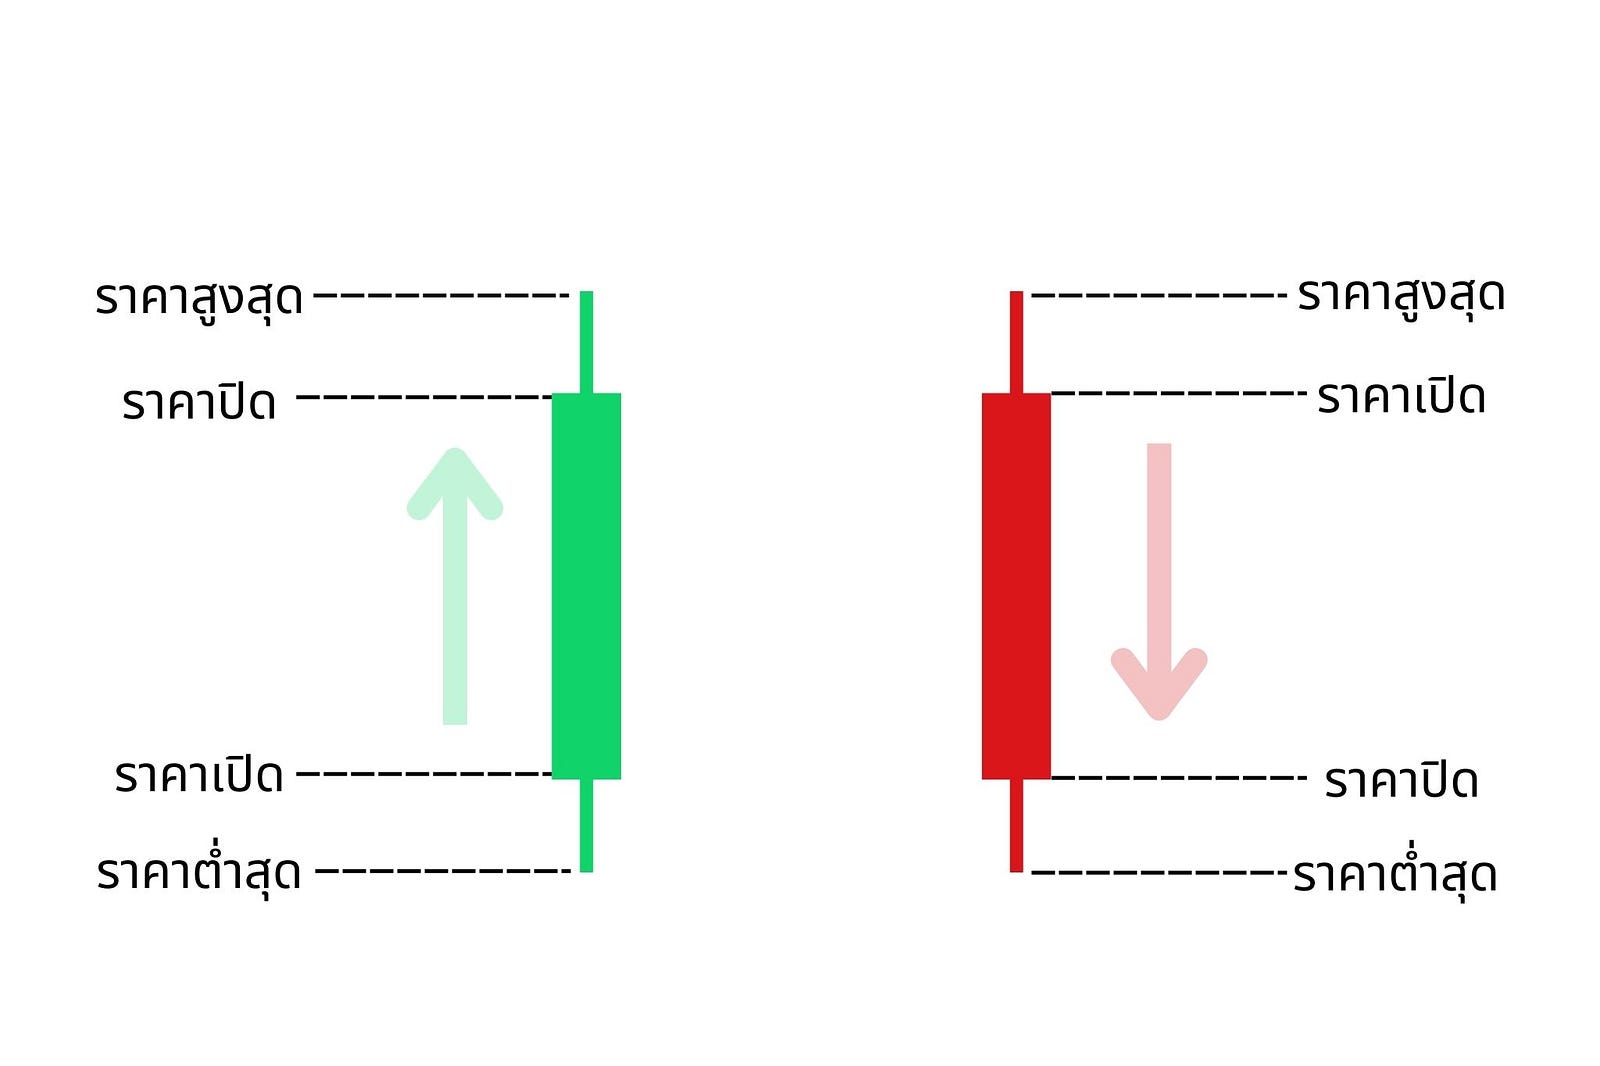
-ราคาเปิด (Open) หมายถึง ราคาซื้อขายแรกของช่วงเวลานั้น
-ราคาสูงสุด (High) หมายถึง ราคาที่ขึ้นไปสูงสุดของช่วงเวลานั้น
-ราคาต่ำสุด (Low) หมายถึง ราคาที่ลงไปต่ำสุดของช่วงเวลานั้น
-ราคาปิด (Close) หมายถึง ราคาซื้อขายสุดท้ายของช่วงเวลานั้น
โดยราคาเปิดและราคาปิดจะแสดงเป็นส่วนที่หนา เรียกว่า ตัว (Body)
ส่วนราคาสูงสุดและต่ำสุดจะแสดงเป็นส่วนที่บาง เรียกว่า หาง (Tail)
ยกตัวอย่าง
ภาพประกอบด้านล่าง เป็นกราฟราคาที่อยู่ในกรอบเวลา (Timeframe) 15 นาที หมายความว่าแท่งเทียนแต่ละแท่งแทนการเคลื่อนไหวของราคาในระยะเวลา 15 นาที ให้สังเกตแท่งเทียนในวงกลมสีแดง
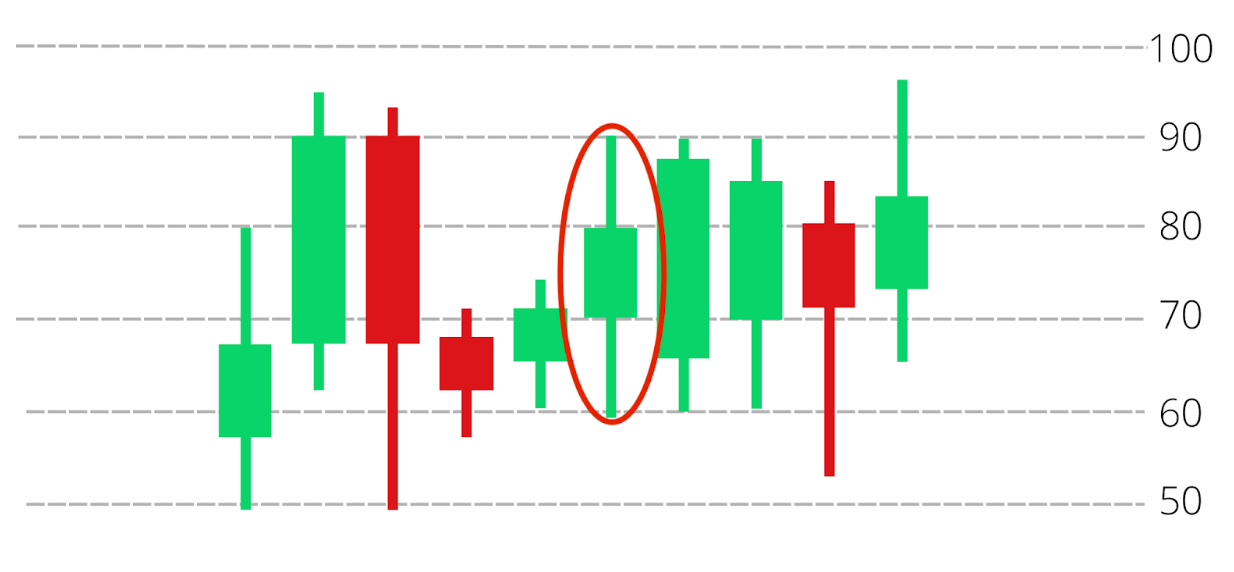
จากแท่งเทียนดังกล่าว เราสามารถวิเคราะห์ได้ว่า ราคาเปิดอยู่ที่ 70 บาท จากนั้นภายในระยะเวลา 15 นาที ราคามีการขึ้นไปทำจุดสูงสุดที่ 90 บาท ทำจุดต่ำสุดที่ 60 บาท และราคาปิดของกรอบเวลาดังกล่าวคือ 80 บาท แท่งเทียนดังกล่าวจึงเป็นสีเขียว เพราะราคาปิดมากกว่าราคาเปิด
ดูรูปร่างของแท่งเทียนเพื่อวิเคราะห์แนวโน้ม
เมื่อเข้าใจแล้วว่าแท่งเทียนแต่ละแท่งสามารถบอกข้อมูลอะไรได้บ้าง อันดับต่อมาเราก็สามารถดูรูปร่างของแท่งเทียนเพื่อวิเคราะห์แนวโน้มของราคาได้ โดยมีรูปร่างแท่งเทียนที่นิยมใช้กันดังนี้
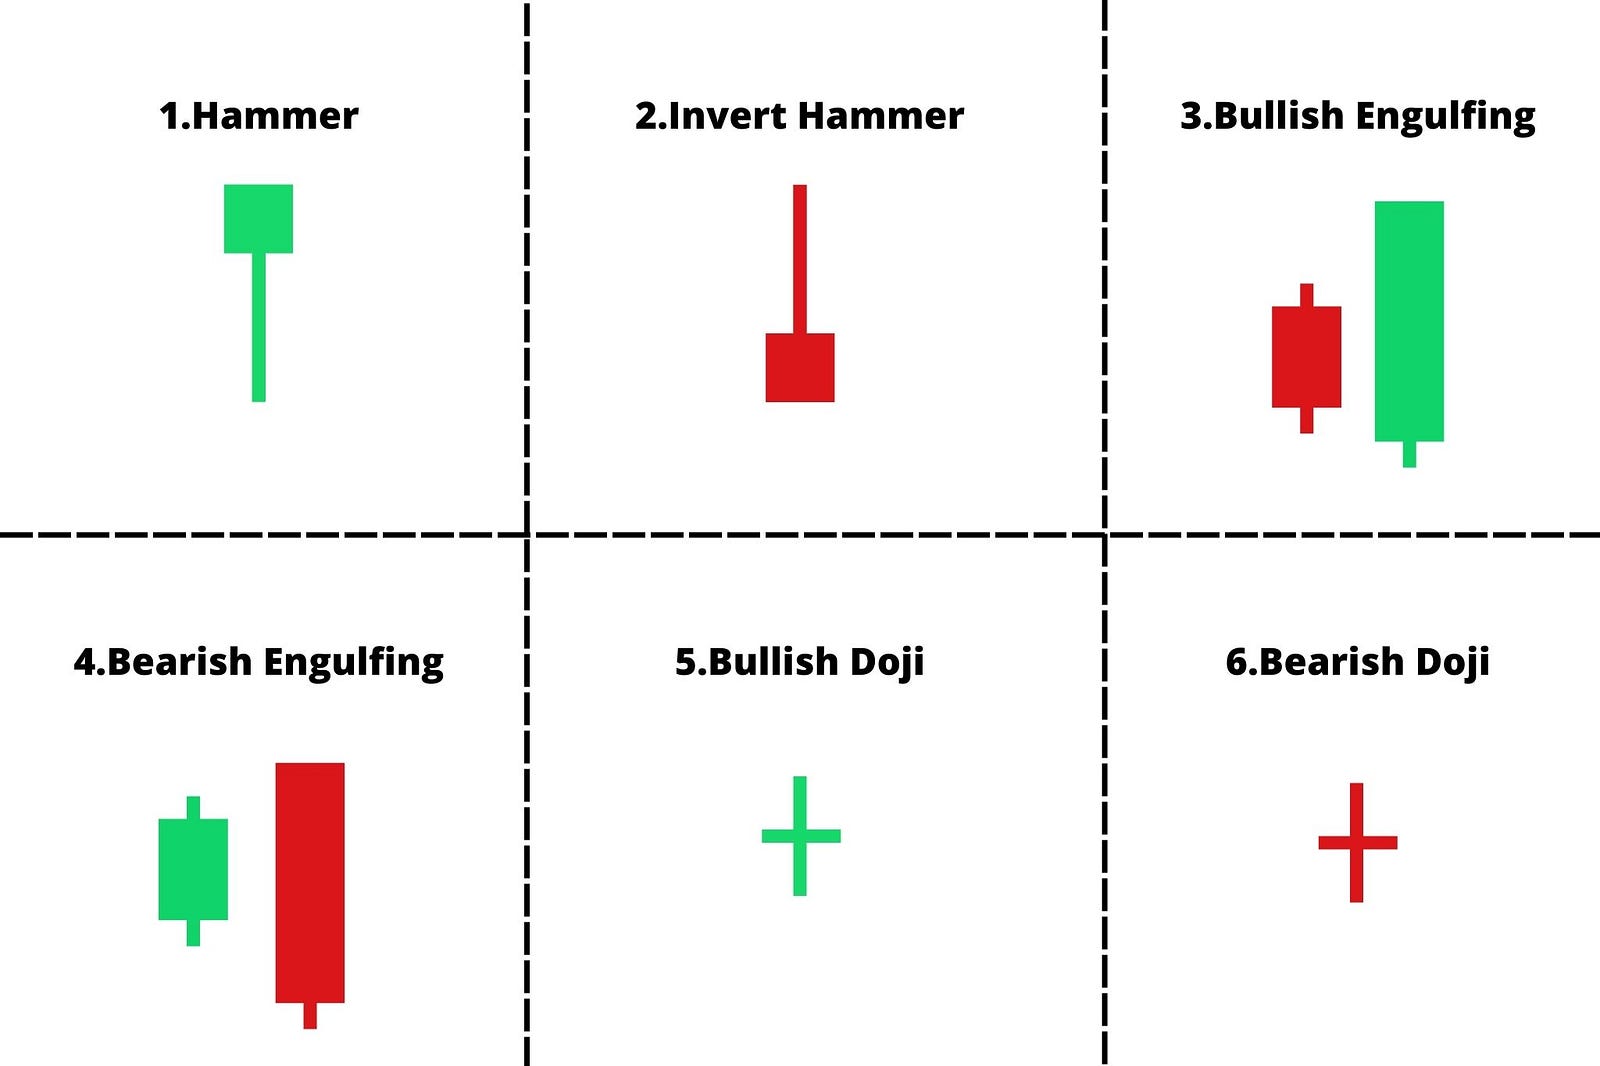
1.Hammer
เป็นแท่งเทียนที่มีตัวสั้นแต่มีหางยาวเกือบเป็นสองเท่าของตัว รูปร่างคล้ายกับค้อนที่หันหัวขึ้น
แนวโน้ม: เป็นสัญญาณว่ามีแรงขายในช่วงแรก แต่ต่อมามีแรงซื้อกลับเข้ามามากในกรอบเวลานั้น ๆ หากเกิดขึ้นในช่วงที่ราคาเป็นขาลง จะมีโอกาสที่ราคาจะกลับตัวเป็นขาขึ้น
2.Invert Hammer
คล้ายกับ Hammer แต่หัวจะอยู่ข้างล่าง และหางจะไปอยู่ด้านบนแทน เหมือนค้อนที่กลับหัว
แนวโน้ม: หางที่ยาวสะท้อนว่ามีแรงซื้อกลับเข้ามา ราคามีโอกาสกลับตัวจากขาลงเป็นขาขึ้น
3.Bullish Engulfing
ประกอบด้วยแท่งเทียน 2 แท่ง แท่งแรกสีแดงมีตัวใหญ่กว่าหาง แต่โดยรวมมีขนาดเล็กกว่าแท่งที่สอง ส่วนแท่งที่สองเป็นสีเขียว โดยมีราคาเปิดต่ำกว่าแท่งแรก แต่มีราคาปิดที่สูงกว่าแท่งแดงอย่างมาก
แนวโน้ม: หากเกิดในช่วงตลาดขาลง การที่ราคาแท่งที่สองเปิดต่ำกว่า แต่สามารถปิดได้สูงกว่าราคาแท่งแรกอย่างมากเป็นสัญญาณว่าอาจเกิดการกลับตัวจากขาลงเป็นขาขึ้น
4.Bearish Engulfing
ประกอบด้วยแท่งเทียน 2 แท่ง แท่งแรกสีเขียวมีตัวใหญ่กว่าหางแต่โดยรวมมีขนาดเล็กกว่าแท่งที่สอง ส่วนแท่งที่สองสีแดง มีราคาเปิดสูงกว่าแท่งแรก แต่ราคาต่ำกว่าแท่งแรกอย่างมาก
แนวโน้ม: หากเกิดในช่วงขาขึ้น การที่เปิดสูงแต่ปิดต่ำกว่าแท่งแรก เป็นสัญญาณว่าอาจเกิดการกลับตัวจากขาขึ้นเป็นขาลง
5.Bullish Doji
มีลักษณะคล้ายเครื่องหมาย + เนื่องจากมีตัวที่แคบ แต่มีหางที่ค่อนข้างยาวทั้งบนและล่าง และราคาปิดสูงกว่าราคาเปิดเล็กน้อยจึงเป็นแท่งสีเขียว
แนวโน้ม: หากเกิดในช่วงขาลง และหากราคาในแท่งถัดไปปรับสูงขึ้น อาจเป็นสัญญาณว่าราคาอาจปรับตัวเป็นขาขึ้น
6.Bearish Doji
มีลักษณะคล้ายเครื่องหมาย + เนื่องจากมีตัวที่แคบ แต่มีหางที่ค่อนข้างยาวทั้งบนและล่าง และราคาปิดต่ำกว่าราคาเปิดเล็กน้อยจึงเป็นแท่งสีแดง
แนวโน้ม: หากเกิดในช่วงขาขึ้น และหากราคาในแท่งถัดไปปรับลดลง อาจเป็นสัญญาณว่าราคาอาจปรับตัวเป็นขาลง
สรุป
การดูกราฟเพื่อวิเคราะห์แนวโน้มราคาเป็นการวิเคราะห์ทางเทคนิครูปแบบหนึ่ง อย่างไรก็ตาม ปัจจัยที่ส่งผลกระทบต่อราคาไม่ได้มีแค่ปัจจัยทางเทคนิคเท่านั้น ยังมีปัจจัยพื้นฐานอย่างข่าวที่เข้ามากระทบ ความน่าเชื่อถือ ความนิยม เป็นต้น การลงทุนโดยใช้การวิเคราะห์ปัจจัยทางเทคนิคควบคู่ไปกับการวิเคราะห์ปัจจัยพื้นฐานจึงกลยุทธ์การลงทุนที่มีประสิทธิภาพที่สุด
บทความ Bitkub Blog ที่คุณอาจสนใจ
ทำความรู้จัก RSI อีกหนึ่งตัวชี้วัดที่อ่านง่ายบนกราฟคริปโทฯ
ลงทุนแบบ DCA กุญแจสู่การบริหารความเครียดจากการลงทุน
แหล่งความรู้ มือใหม่หัดเทรดคริปโต เริ่มต้นที่นี่
ปรากฏการณ์ Bitcoin Halving คืออะไร?
— — — — -
ติดตามบทความ ข่าวสาร และความรู้ที่น่าสนใจเรื่อง บิทคอยน์ (Bitcoin), Cryptocurrecy และความรู้อีกมากมายในวงการคริปโต ได้ที่ Bitkub Blog
* คริปโทเคอร์เรนซีและโทเคนดิจิทัลมีความเสี่ยงสูง คุณอาจสูญเสียเงินลงทุนได้ทั้งจำนวน โปรดศึกษาและลงทุนให้เหมาะสมกับระดับความเสี่ยงที่ยอมรับได้
** สินทรัพย์ดิจิทัลมีความเสี่ยง โปรดศึกษาและลงทุนให้เหมาะสมกับระดับความเสี่ยงที่ยอมรับได้
*** ผลตอบแทนของสินทรัพย์ดิจิทัลในอดีตหรือผลการดำเนินงานในอดีต มิได้เป็นสิ่งยืนยันถึงผลตอบแทน ของสินทรัพย์ดิจิทัลหรือผลการดำเนินงานในอนาคต
— — — — -
How to read cryptocurrency charts for new traders
This article is a basic guide on how to read cryptocurrency charts, aimed at providing readers with the foundational knowledge needed to improve their cryptocurrency trading skills.
What are the types of Crypto charts?
Let’s start with the types of crypto charts, as they are the first thing that everyone sees when entering the trading page. The popular types of charts used can be divided as follows:
1.Candlestick chart

2.Bar chart

3.Line chart

How to read Candlestick charts
This article focuses on candlestick charts, as they are the most popular chart among both new and experienced traders.
Candlestick charts have the advantage of being able to provide multiple types of information at a glance. The individual candlestick is composed of the following components:
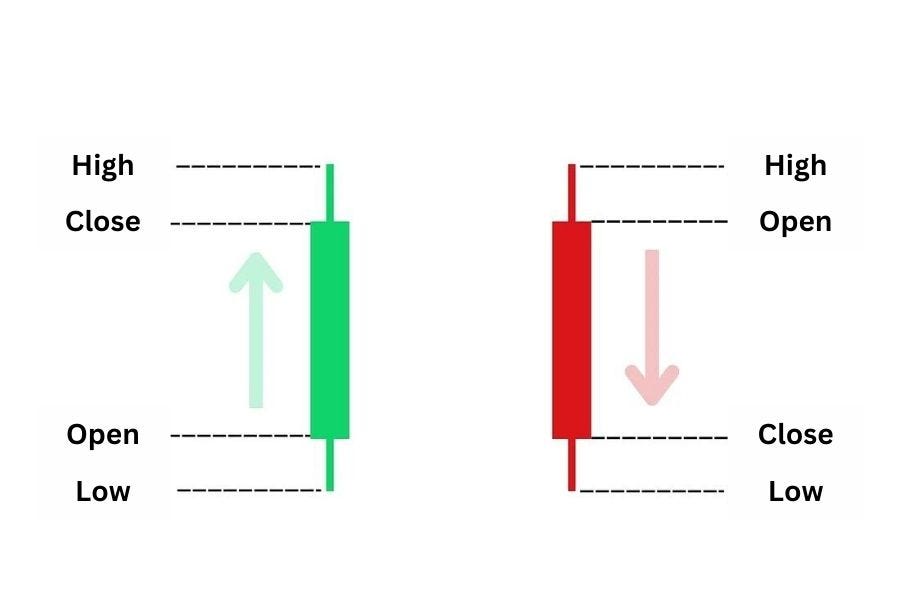
- Open: the first traded price of the time period
- High: the highest price reached during the time period
- Low: the lowest price reached during the time period
- Close: the last traded price of the time period
The open and close prices are shown as the thick part of the candlestick, called the “body,” while the high and low prices are shown as the thin parts, called the “wicks” or “tails”.
Example:

The illustration below is a price chart within a 15-minute timeframe, meaning each candlestick represents the price movement over a 15-minute period. Take note of the candlestick circled in red.
From this candlestick, we can analyze that the opening price was at 70 baht. Within the 15-minute timeframe, the price went up to a high of 90 baht, went down to a low of 60 baht, and closed at 80 baht. Therefore, this candlestick is green, indicating that the closing price is higher than the opening price.
Analyzing the shape of candlesticks to determine trends

Once you understand what information each candlestick can provide, the next step is to analyze the shape of candlesticks to determine the trend of the price. The following are commonly used candlestick shapes for this purpose.
1.Hammer
It is a candlestick with a short body and a long tail that is almost twice the length of the body. The shape resembles a hammer with the head facing up.
Trend: It is a sign that there was selling pressure in the beginning, but later there was significant buying pressure within that timeframe. If it occurs in a downtrend, there is a chance that the price may reverse and start an uptrend.
2.Inverted Hammer
Similar to a Hammer, but the head is located at the bottom and the tail is at the top, like an upside-down hammer.
Trend: The long tail reflects buying pressure coming back in, and there is a chance that the price may reverse from a downtrend to an uptrend.
3.Bullish Engulfing
Consists of two candlesticks. The first candlestick is red and has a larger body than its tail, but overall it is smaller than the second candlestick. The second candlestick is green and has a lower opening price than the first candlestick, but a much higher closing price.
Trend: If it occurs during a market downturn, the fact that the opening price of the second candlestick is lower but can close much higher than the first candlestick is a signal that a reversal from the downturn to an upturn may occur.
4.Bearish Engulfing
Consists of two candlesticks. The first candlestick is green and has a larger body than its tail, but overall it is smaller than the second candlestick. The second candlestick is red and has a higher opening price than the first candlestick, but a much lower closing price.
Trend: If it occurs during an uptrend, the fact that it opens higher but closes much lower than the first candlestick is a signal that a reversal from the uptrend to a downtrend may occur.
5.Bullish Doji
This candlestick pattern resembles a cross (+) due to its narrow body and relatively long upper and lower tails. The closing price is slightly higher than the opening price, resulting in a green candlestick.
Trend: If it occurs during a downtrend and the next candlestick closes higher, it may signal a potential reversal to an uptrend.
6.Bearish Doji
This candlestick pattern also resembles a cross (+) due to its narrow body and relatively long upper and lower tails. The closing price is slightly lower than the opening price, resulting in a red candlestick.
Trend: If it occurs during an uptrend and the next candlestick closes lower, it may signal a potential reversal to a downtrend.
Summary
Analyzing price trends through chart analysis is one type of technical analysis. However, factors that affect prices are not limited to technical factors alone. There are also fundamental factors such as news, credibility, popularity, and more. The most effective investment strategy is to combine technical analysis with fundamental analysis.
— — — — -
Follow additional knowledge on Bitkub or our Bitkub Blog
- Let’s learn about Bitcoin and Cryptocurrency. To help you better understand the world of crypto at Bitkub Blog and if you are a beginner. Find out more in the article.
- Cryptocurrency and digital tokens involve high risks; investors may lose all investment money and should study information carefully and make investments according to their own risk profile.
- Digital assets involve risks; investors should study information carefully and make investments according to their own risk profile.
- Returns/Past Performance does not guarantee future returns/performance.
ที่มา:
Medium